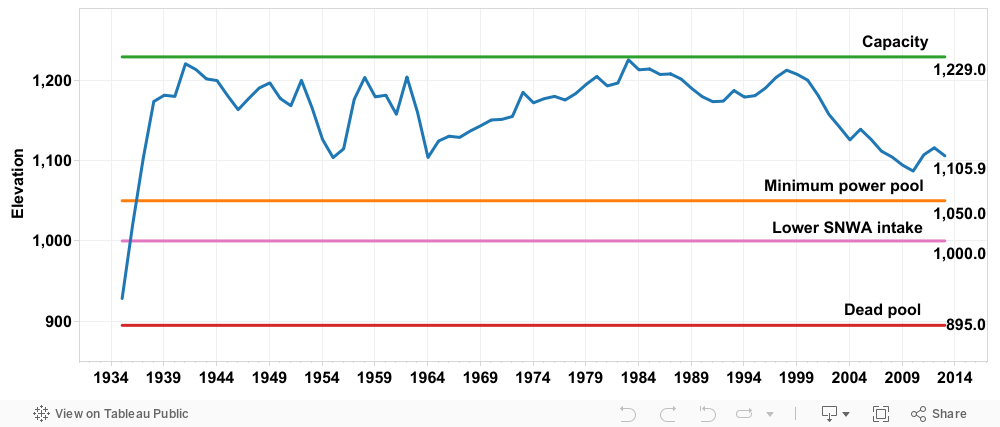
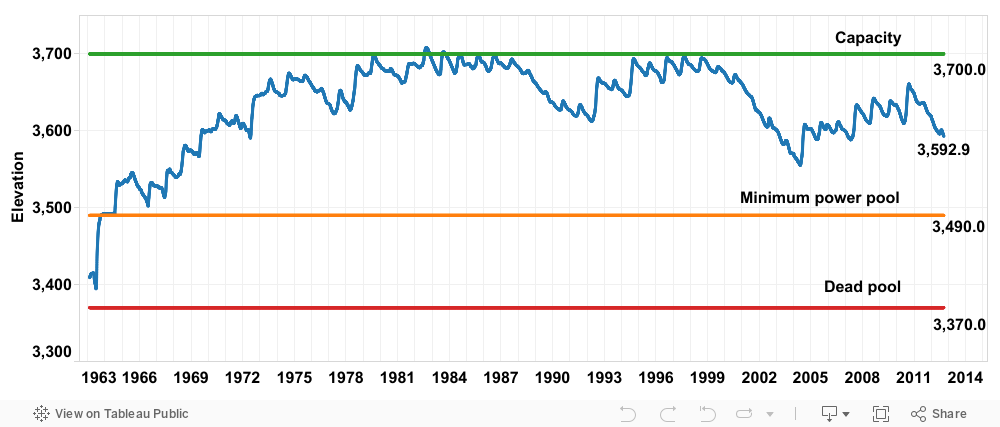
The graphics below show the historical elevation and critical benchmarks for Lake Powell and Lake Mead, two reservoirs on the Colorado River. The Powell chart plots the daily elevation and the Mead chart illustrates the July 1 level.
Capacity shows the elevation when the reservoirs are full. Flooding in 1983 nearly over-topped Glen Canyon Dam. When a reservoir is at dead pool, the water level is so low that it cannot drain by gravity through the dam’s outlet works. Hydropower can only be generated when the reservoir is above the minimum power pool. For Mead, which supplies the Las Vegas metro area, the elevation of the Southern Nevada Water Authority’s intake is shown. See this post for more details.
Lake Powell daily elevation
Lake Mead July 1 elevation